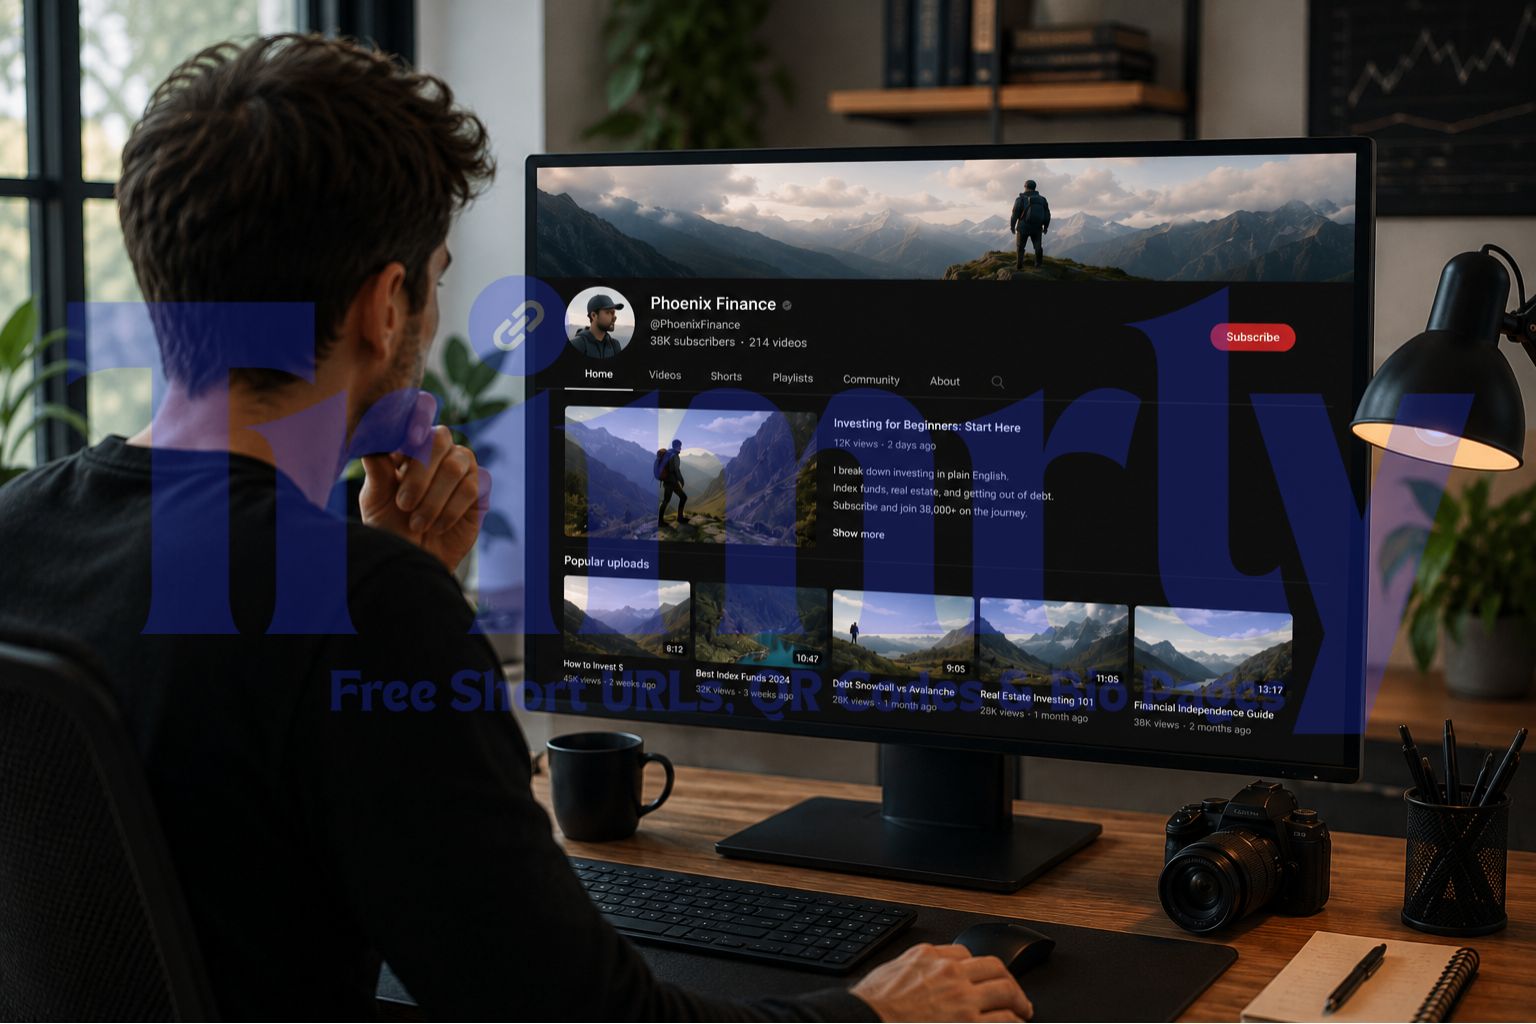

Maya Reyes had been posting on Instagram for four years. Her food photography was consistently strong, her seasonal recipe content performed well, and she had grown her following to over 27,000 without paid promotion. What she had not paid attention to was what happened after people arrived at her bio page.
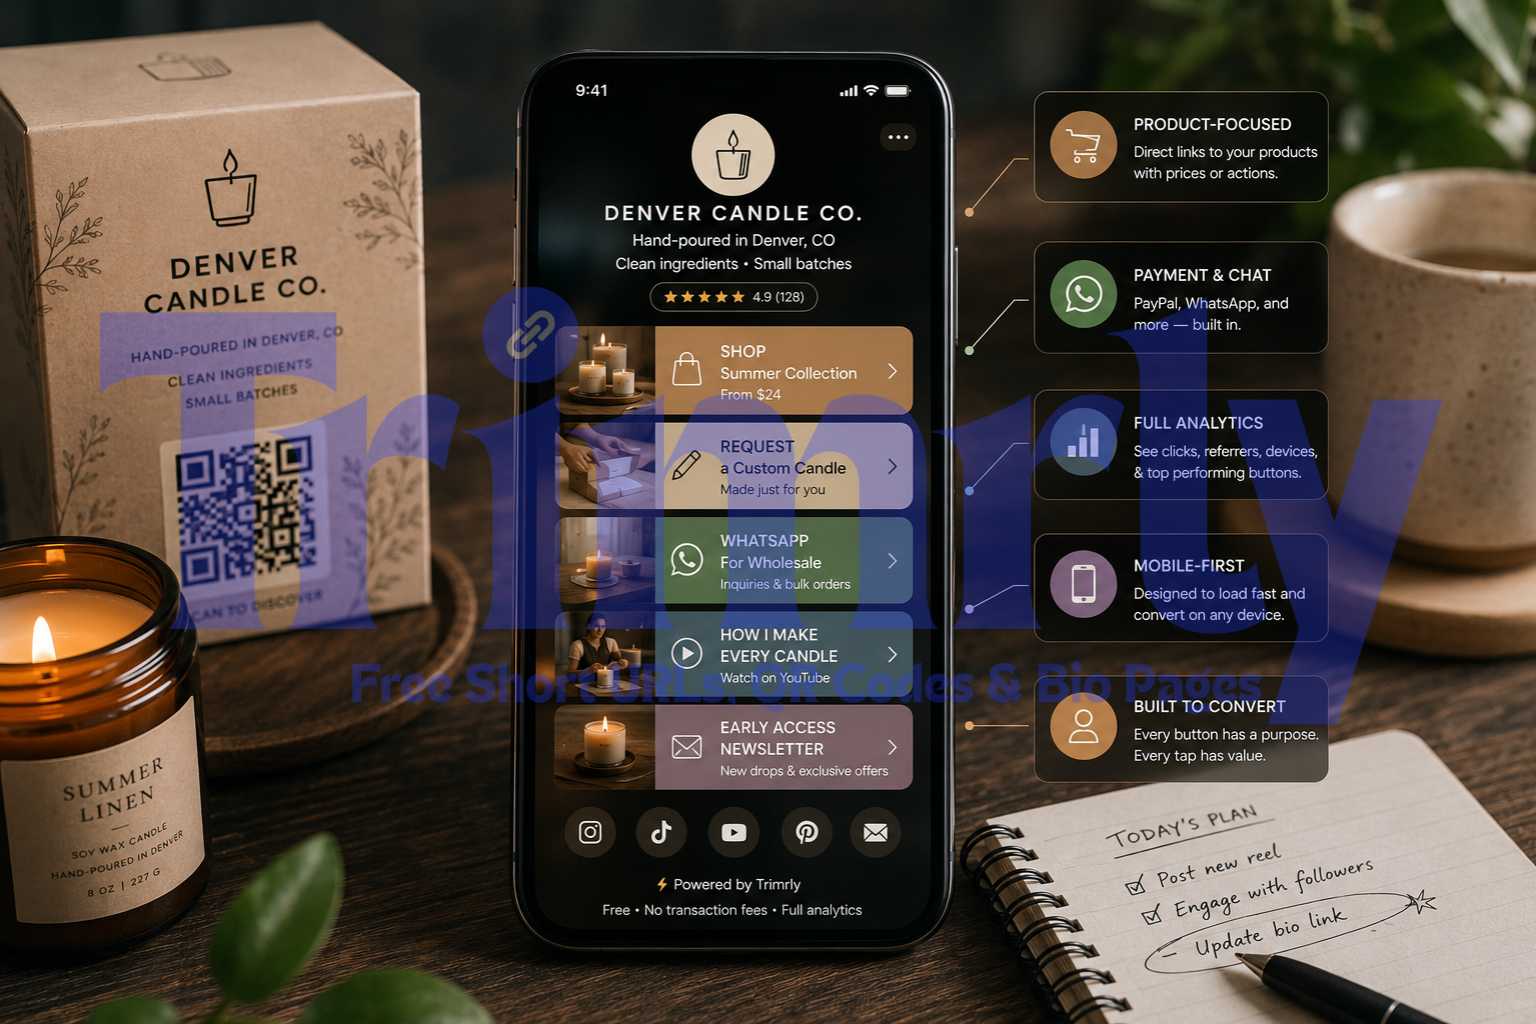
The page had seven buttons, each labeled with a destination name: "My Website," "Recipes," "Shop," "Newsletter," "YouTube," "TikTok," and "Contact." It had been set up in 2023 and barely touched since. Her profile photo was a product shot of her most popular pantry item, not her face. The bio description read: "Seasonal recipes and Pacific Northwest living. Portland, OR."
She knew her bio link was underperforming but assumed the problem was her follower count. When she looked at her Trimrly analytics for the first time with real attention, the problem became visible immediately.
The Starting Problem: What the Analytics Revealed
Before making any changes, Maya spent 20 minutes reading her Trimrly dashboard properly for the first time. What she found explained the underperformance precisely.
Of her seven bio page buttons, three were getting almost no clicks. "TikTok," "YouTube," and "Contact" collectively received 4 to 6 clicks per week combined, despite sitting on the page and occupying visual space. Her "Shop" button was getting the most clicks at 31 per week, but it was positioned fourth, after "My Website," "Recipes," and "Newsletter." Her highest-converting button was buried behind three lower-performing ones.
The picture was clear. Her best-performing button was fourth. Her three weakest buttons were taking up space and adding visual noise without contributing clicks. Her profile photo was a product image, not her face. And her bio description gave visitors no reason to tap the link.
She decided to make five changes, one per week, and measure the impact of each one using Trimrly's per-button analytics. No guessing. Every change isolated and tracked.
The Five Changes, Measured One at a Time
01
The analytics showed "Shop" was already the most-clicked button despite being fourth in the list. Maya's audience was scrolling past three buttons to reach it. The fix was simple: move "Shop" to the first position and leave everything else unchanged for one week to measure the isolated impact.
She also rewrote the label from "Shop" to "Shop the Fall Pantry Collection — From $18." The price in the label was a deliberate test based on research showing that labeling the price pre-click qualifies buyers and increases post-click purchase intent. The 📦 emoji at the front created visual contrast against the surrounding buttons.
Before
After
02
With the Shop button repositioned and the first week's data in, Maya removed "YouTube," "TikTok," and "Contact." These three buttons had collectively received 16 clicks in week one, all from visitors who had already passed the Shop and Website buttons. More importantly, they were adding visual length to the page that required scrolling on a standard mobile screen.
The decision to remove them was not intuitive. Maya's first instinct was that removing links meant giving visitors fewer options. Her analytics showed the opposite: three low-click buttons were creating scroll friction and potentially diluting the attention available for the four that mattered. The research on decision paralysis supports this, but the Trimrly data made it specific to her page rather than theoretical.
She dropped from seven buttons to four: Shop (renamed and repositioned), My Website, Recipes, and Newsletter. She also rewrote "Recipes" to "Free Seasonal Recipe Library" and moved it above "My Website."
03
Maya's bio page profile photo was a professionally shot overhead image of her signature chili oil. It was a beautiful photo. It was the wrong photo for a bio page. Her Instagram audience had been following her face, her hands in recipes, and her voice in Stories and Reels. The product shot created an immediate visual mismatch when they arrived at her bio page.
She replaced it with a recent portrait taken in her kitchen, natural light, warm tones, no filter. The same aesthetic as her content but centered on her face rather than a product. The change took about three minutes in the Trimrly bio page editor.
This change is not easily isolated in analytics because it affects overall page trust rather than a specific button's performance. The signal it produces is in the overall click-through rate from page visits to button taps. The week after the photo change, total page visits were consistent at approximately 2,450, but total button clicks rose from 117 to 124.
04
Maya's original bio description on Instagram — "Seasonal recipes and Pacific Northwest living. Portland, OR." — was factually correct and completely inert. It described her niche but gave the visitor scanning her profile no reason to tap the link.
She rewrote it to: "I make small-batch pantry staples that actually taste different. Chili oils, herbed vinegars, and seasonal preserves from Portland, OR. The fall drop is live 👇"
The rewrite did three things. It described what made her products different rather than just what they were. It gave the visitor a specific, time-bounded reason to tap the link. And it used a downward arrow emoji as a visual direction immediately before the bio link field, creating a physical cue from text to tap.
This change is tracked through the downstream effect on the Shop button specifically, because the description now explicitly directed visitors toward the fall collection. The week after the bio rewrite, Shop button clicks rose from 51 to 63.
05
The four previous changes were all on-page adjustments. This one was off-page: Maya pinned a Reel to her profile grid that explicitly named her bio page destination. The Reel was a 37-second video showing herself making the chili oil in real time, ending with: "The fall batch is limited. Ordering details are at trimrly.com/maya-reyes, link in my bio."
She said the destination URL aloud. She showed the product being made. She referenced the scarcity. Every profile visitor who watched that pinned video before reaching her bio was pre-primed for exactly what they would find at the first button.
Pinned Reels appear first in the profile grid and get seen by every visitor who scrolls the grid during a profile visit. The effect on bio page traffic was measurable from the day it was pinned. Profile visits did not increase significantly, but the percentage of profile visitors who tapped the bio link rose.
Apply These Five Changes to Your Bio Page
Per-button analytics, 45+ widgets, permanent data. Build and measure your bio page free. No credit card. No 28-day analytics expiry.
The Six-Week Results in Full
Baseline — no changes made
94 bio page clicks from 2,470 profile visits. 3.8% click rate. 7 buttons, generic labels, product photo, unchanged since 2023.
94 clicks/week · 3.8% CTR
Change 1: Shop button moved to position 1, label rewritten with price
Shop clicks: 31 → 51. Most significant single change of the six weeks.
108 clicks/week · +14.9%
Change 2: Removed 3 zero-performance buttons, rewrote "Recipes" label
Page dropped from 7 to 4 buttons. All remaining buttons saw click rate increases.
117 clicks/week · +8.3%
Change 3: Product photo replaced with face photo
Trust signal improvement. Overall page visit-to-click conversion rate rose to 5.1%.
124 clicks/week · +6.0%
Change 4: Instagram bio description rewritten to reference the fall collection and bio link
Shop button clicks rose 23.5% from this single copy change. Arrow emoji direction cue added.
128 clicks/week · +3.2%
Change 5: Pinned Reel referencing the bio link URL by name
Visible increase in profile-visit-to-click conversion. Click rate held at 5.3% through week 6.
131 clicks/week · 5.3% CTR · +39.4% vs baseline
What Changed in the Analytics Dashboard After Week 6
The distribution shifted significantly. At baseline, the most clicked button (Shop) was getting 33% of all bio page clicks. After six weeks, it was getting 48% of clicks, which reflected both the repositioning and the label change directing higher-intent visitors to it first. The Recipes button went from 17 clicks to 34, almost entirely due to the label rewrite from "Recipes" to "Free Seasonal Recipe Library." The word "Free" produced a measurable lift in clicks on that button alone.
"Forty percent more clicks from the same followers means forty percent more revenue from the same content investment. The bio page was the gap the whole time."
What Maya Did Not Change (And Why)
It is worth being explicit about what stayed the same, because the isolation methodology only works if unrelated variables are held constant.
Maya did not change her posting frequency. She averaged 4.2 posts per week at baseline and 4.3 posts per week during the six-week test. She did not run a sale or promotion on her shop that would have independently driven traffic. She did not collaborate with other accounts or run any paid promotion. Her follower count grew by 340 during the six-week period, which was consistent with her historical growth rate and had no meaningful effect on the click rate calculation.
The Trimrly device analytics confirmed the audience composition stayed stable throughout. The iOS and Android split held within two percentage points of its baseline. The geographic distribution of clicks remained predominantly Oregon and Washington state with a consistent secondary cluster in California. Nothing in the audience changed. Only the bio page changed.
The Changes Ranked by Impact
| Change | Week | Clicks Before | Clicks After | Lift | Time to implement |
|---|---|---|---|---|---|
| Move top button to position 1 + rewrite label with price | 1 | 94/week | 108/week | +14.9% | 8 minutes |
| Remove zero-click buttons, reduce to 4 | 2 | 108/week | 117/week | +8.3% | 5 minutes |
| Replace product photo with face photo | 3 | 117/week | 124/week | +6.0% | 3 minutes |
| Rewrite bio description to prime first button | 4 | 124/week | 128/week | +3.2% | 12 minutes |
| Pin a Reel referencing bio link by name | 5–6 | 128/week | 131/week | +2.3% | 40 minutes (filming + posting) |
The lesson from the ranking is uncomfortable for anyone who enjoys complex strategies: the two highest-impact changes were the simplest. Moving a button took eight minutes. Removing buttons took five. Together, they accounted for 23.2 of the 37-point improvement in weekly click rate. The face photo took three minutes and contributed another 6 points. The copy changes and the pinned Reel, both of which required more time and creative effort, contributed the smallest portions of the overall gain.
The methodology Maya used is fully replicable with any Trimrly bio page. Check per-button analytics to identify your highest-clicked button. Move it to position 1. Identify and remove buttons with under 5% of total clicks. Replace product or logo images with face photos. Rewrite the bio description on Instagram to reference the first button explicitly. Pin a piece of content that mentions the bio link. Check analytics after each change before making the next one.
Frequently Asked Questions
Six weeks of one change per week, each tested in isolation and measured with Trimrly's per-button analytics before the next change was made. The total time spent on bio page edits across the six weeks was approximately 71 minutes. The pinned Reel took additional time to film and post, but the on-page changes were all completed in under 30 minutes combined. The methodology matters as much as the changes themselves: making all five changes simultaneously would not have revealed which change drove which result.
Yes. Trimrly's free plan includes per-button click tracking on every bio page, with device breakdown, country data, referral source, and timestamp for each click. The data is stored permanently with no expiry. This is the same analytics layer Maya used throughout the six-week experiment. Creating a free account and checking your analytics for the first time typically takes under five minutes and immediately reveals which buttons your audience actually uses versus which ones are taking up visual space.
Yes, when the removed buttons were low-performing. The mechanism is decision paralysis: too many options reduce the likelihood of any single option being chosen. In Maya's case, removing three buttons that collectively received under 5% of all clicks produced an 8.3% increase in total clicks across the remaining buttons. The visual simplification also reduced the page length and eliminated scrolling for most mobile visitors. The threshold for removal is any button receiving under 5% of total weekly clicks for two consecutive weeks. If it is not contributing clicks, it is subtracting them by adding visual noise.
Price visibility before the tap does two things simultaneously. It removes uncertainty for visitors who are ready to buy: they know immediately whether the product is in their budget without having to click through to find out. And it filters out visitors who are not ready to buy, which sounds counterproductive but actually improves post-click conversion rates because the clicks that happen are from more qualified visitors. A label like "Shop the Fall Collection — From $18" generates fewer total clicks than "Shop" might on a high-curiosity audience, but the clicks it generates have higher purchase intent. In Maya's case, both total clicks and post-click shop page activity increased, suggesting the price labeling attracted more qualified visitors without deterring casual browsers.
Log into your Trimrly account, go to your bio page in the dashboard, and open the analytics view. The click count for each button appears alongside the button label in the analytics panel. Sort by clicks to see which button has the most clicks in your selected time window. Weekly is the most useful view for identifying patterns without being affected by a single unusual day. If you have not checked this before, start with the last 30 days. The button with the most clicks in that window is the one that belongs in position one on your page if it is not already there.