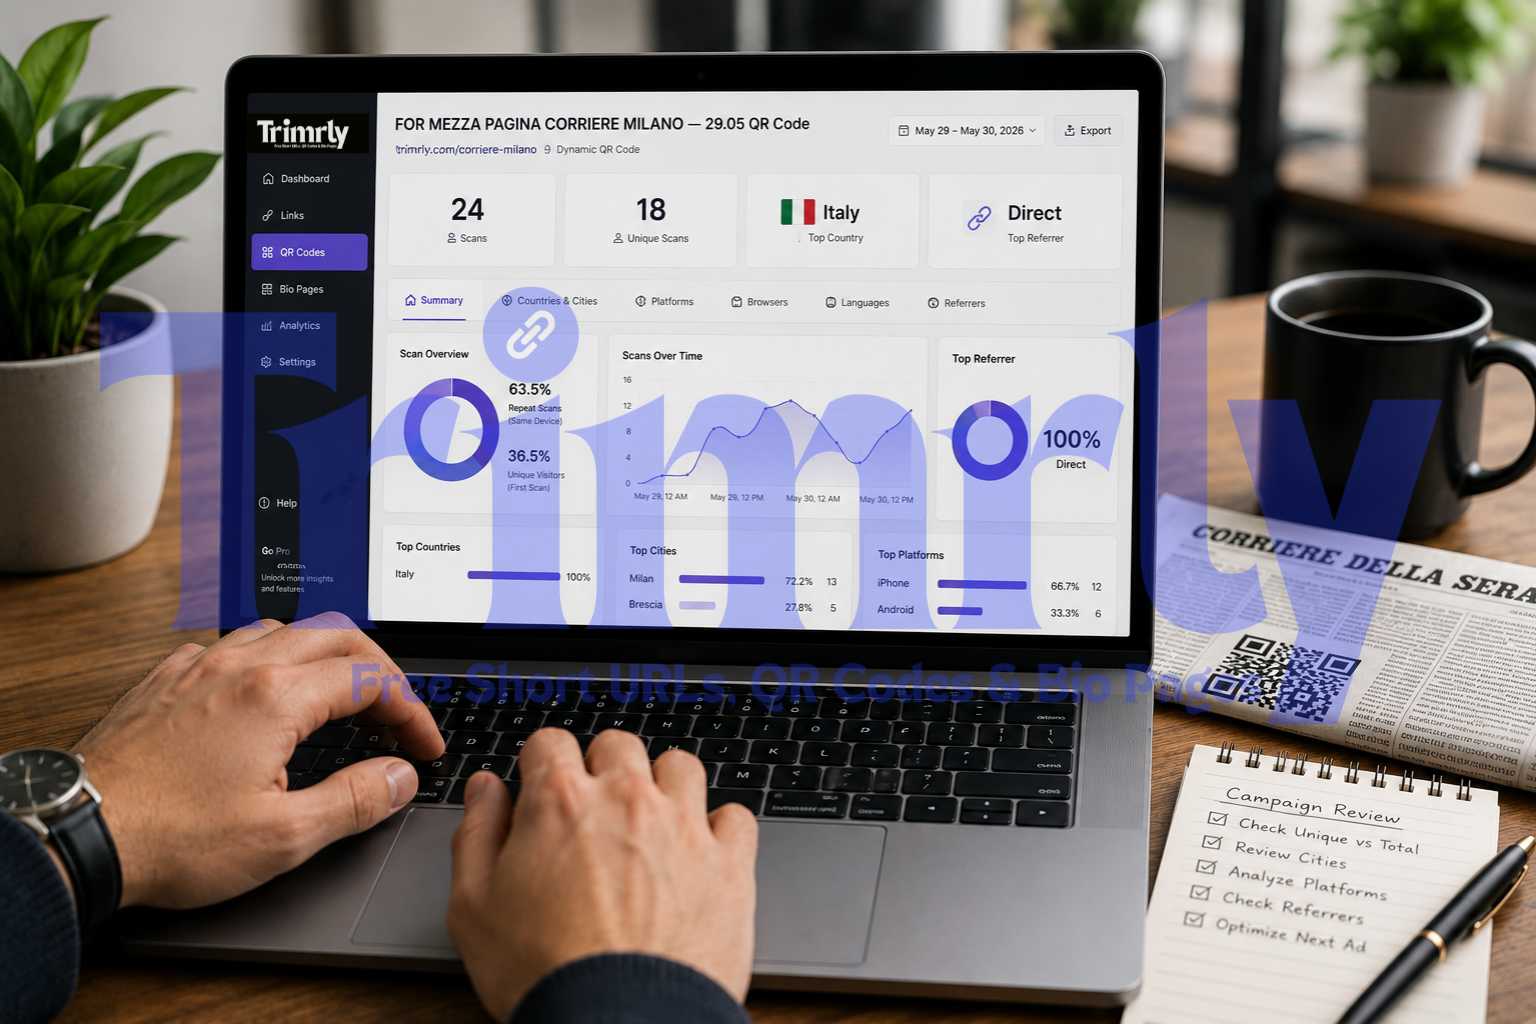
On 29 May 2026, a half-page advertisement ran in Corriere della Sera, one of Italy's most widely read newspapers. The ad included a QR code. By the end of the following day, the Trimrly dashboard for that code showed 24 total scans and 18 unique scans, with all activity concentrated in Milan and Brescia. Every scan came from Italy. Every scanner was using an iPhone or Android. The referrer was direct on every single entry.
That last detail is the one most people would overlook. Direct referral on a newspaper QR code is not a gap in the data. It is confirmation that the code is working exactly as expected: people are picking up the paper, opening their camera app, and scanning. No intermediate link, no social share, no email click. The referrer data is validating the channel, not failing to track it.
That kind of interpretation is what separates a business that uses QR analytics from one that just collects them.
24
18
🇮🇹
Direct
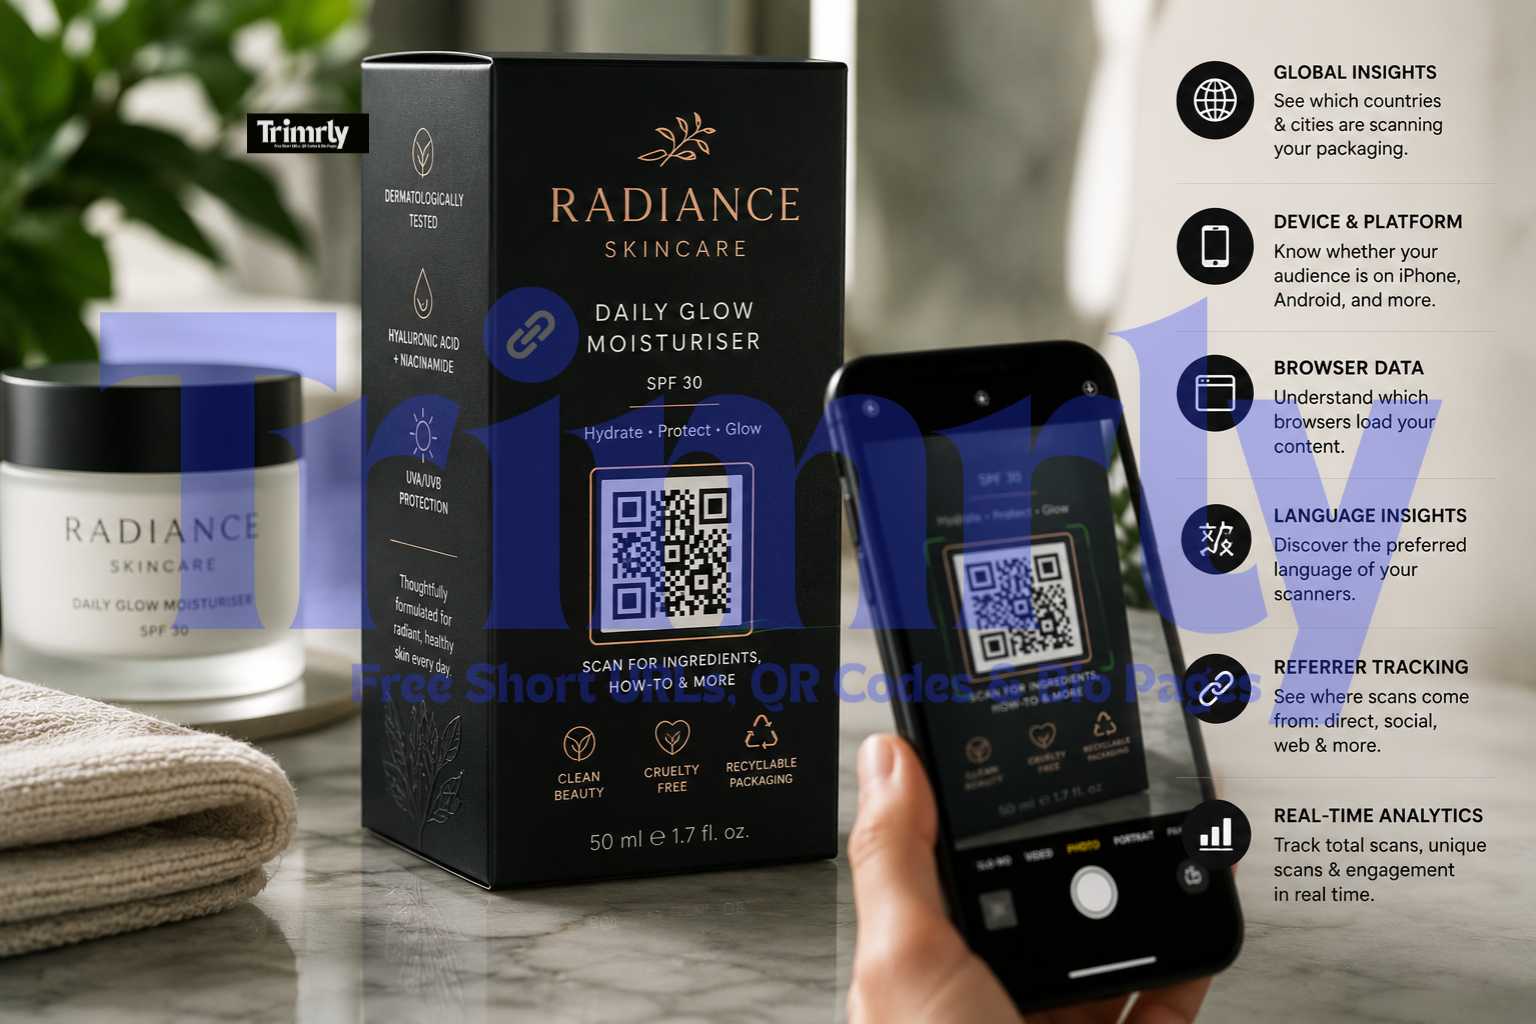
The Six Tabs in Your Trimrly Dashboard, and What Each One Answers
Trimrly's QR analytics panel is organised into six distinct data sections. Each one answers a different business question. The mistake most people make is checking only the Summary tab and treating the other five as secondary information. They are not secondary. They are often where the most actionable intelligence lives.
Summary
Total scans, unique scans, top country, and top referrer in a single view. The starting point for any campaign check. Never the ending point.
Campaign reach baseline
Countries & Cities
Breakdown of every scan by country and city. Tells you whether the physical placement is reaching the intended geographic audience or surfacing unexpected markets.
Placement validation
Platforms
Device type and operating system for every scan: iPhone, Android, the specific OS versions. Tells you whether your destination page needs to be optimised for a specific platform first.
Destination optimisation
Browsers
Which browser loaded the destination: Safari, Chrome, Samsung Internet, others. Flags rendering issues before they affect a large portion of your audience.
Technical QA signal
Languages
The language setting of each scanner's device. Shows whether your audience's native language matches the language of your destination page.
Content localisation
Referrers
Where the scan originated: direct camera scan, a messaging app, a browser redirect, or a social platform. Confirms channel attribution for every piece of printed material carrying a QR code.
Channel attribution
Total Scans vs Unique Scans: The Number That Actually Measures Reach
This is the most misread pair of numbers in QR analytics, and the misreading costs money.
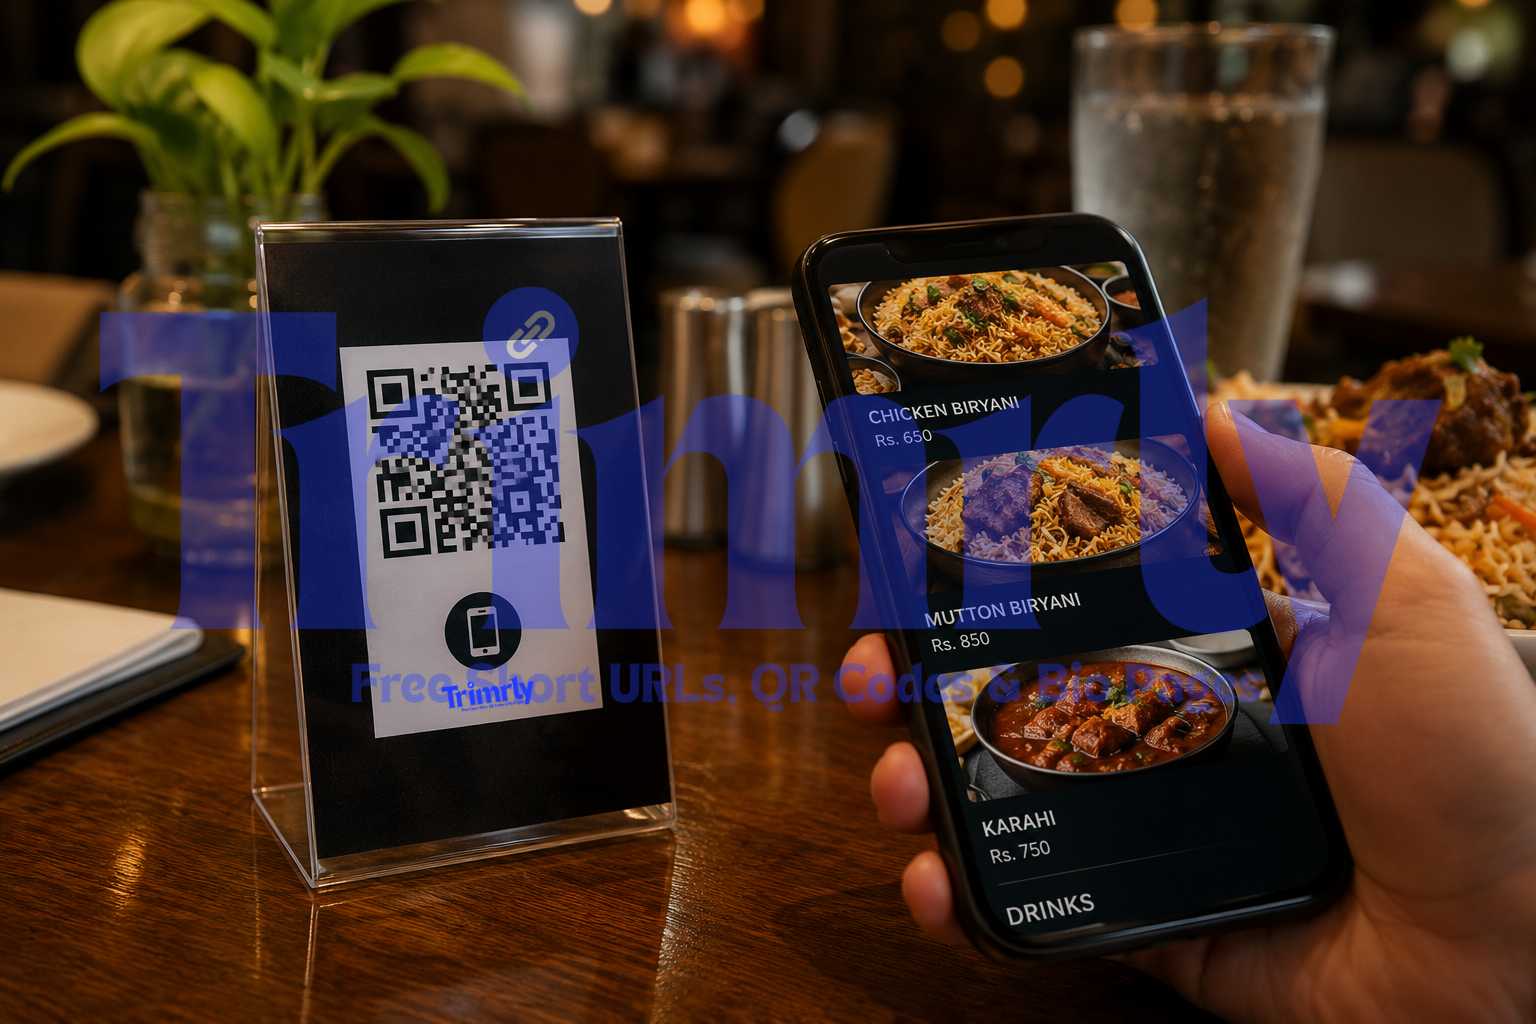
Total scans count every scan event, including multiple scans from the same device. If one person scans a restaurant QR menu four times during a two-hour visit, that is four total scans and one unique scan. If you report total scans as your reach figure in a campaign review, you are overstating your actual audience by a measurable factor.
QRLynx's 2026 benchmark data across 5 million scan events found that 63.5% of all QR scans are repeat scans, meaning only 36.5% are unique visitors. The average total scan count overstates unique reach by approximately 2.7 times. A campaign reporting 1,000 total scans likely reached around 370 unique people.
The repeat rate is not always a problem. For use cases with an inherent return-visit pattern, menus, WiFi codes, event schedules, resource directories, a high repeat rate is confirmation that people are finding the destination useful enough to return. For single-use campaign codes, a high repeat rate compared to unique scans tells you a small number of people engaged deeply while the broader audience did not reach the code at all.
In the Corriere della Sera example: 24 total scans, 18 unique scans. That is a 75% unique rate, substantially better than the 36.5% benchmark. In a single print run of a newspaper, that ratio tells you almost every person who scanned did so once from curiosity or intent, not because they were returning for content. That is a healthy signal for a print ad QR code.
When presenting QR code performance to any stakeholder, always report unique scans as your reach figure and total scans as your engagement figure. "We reached 18 unique people and generated 24 total scan events" is accurate and defensible. "We got 24 scans" is ambiguous and inflated.
Reading a Real Dashboard: The Italian Newspaper Ad
Half-Page Print Ad — QR Code Placed 29 May 2026
A QR code was placed in a half-page advertisement in Corriere della Sera, one of Italy's largest circulation newspapers, on 29 May 2026. The code was named "FOR MEZZA PAGINA CORRIERE MILANO — 29.05" in the Trimrly dashboard, making it immediately identifiable when reviewing multiple campaign codes.
By the following day, 24 total scans had registered, 18 of them unique. The Countries and Cities tab showed all activity concentrated in Milan and Brescia, both in Northern Italy, where Corriere della Sera has its strongest readership base. The Platforms tab showed a mix of iPhone and Android devices. The Browsers tab showed Safari and Chrome, matching the device split. The Languages tab showed Italian as the consistent device language. The Referrers tab showed Direct across all entries.
The direct referrer result deserves specific attention. A "direct" referrer on a QR scan means the person opened their camera app or QR scanner app and scanned the physical code. There was no social share, no web link, no email redirect involved. This is exactly what the analytics should show for a print ad. If the referrer had shown a social platform, it would suggest someone had photographed and reshared the ad digitally, which would be additional signal worth noting. Direct referrers here are not missing data. They are confirmation of the channel.
Countries and Cities: What Geographic Data Actually Tells You
Geographic data answers the question every physical campaign needs answered: did the material reach the right place?
For a print newspaper ad in Milan, seeing Milan and Brescia as the top cities is not just reassuring. It is the proof that the ad ran correctly in the correct edition. If the geographic data had shown scans from Rome or Naples instead, that would immediately raise a flag about which edition the ad appeared in, whether the wrong regional edition was printed, or whether the code had been redistributed digitally in different cities.
For multi-location businesses, city-level data resolves which locations are contributing most to QR-driven engagement. A chain with QR codes at five restaurants can see from the Cities tab whether all five are generating scans or whether one location accounts for 80% of the activity. That imbalance has a physical cause: the code placement, the menu position, or the staff's behaviour at one location is different. Analytics make that visible. A paper scan count sheet never would.
QR Insights documented a retail chain that found 40% of their QR scans were coming from three cities they had not specifically targeted. They investigated, found those cities had high organic interest in their product category, and opened new locations there. Geographic data in QR analytics does not just validate existing strategy. It occasionally reveals where your next move should be.
Platforms and Browsers: Why Device Data Changes Your Destination Decisions
Platform and browser data solves a problem that most businesses discover too late: their destination page works fine on the device they tested it on and poorly on the device their audience actually uses.
IMQRScan's 2026 data across 47 million scans confirms that 98% or more of QR scans happen on mobile devices. The specific split between iOS and Android matters for two reasons. First, iOS users with iPhone can scan QR codes directly from the native camera app without downloading anything. This creates a frictionless experience that tends to produce higher scan rates in iOS-dominant markets. Second, if your destination page has rendering issues that are specific to Safari on iOS or to Chrome on Android, platform data tells you precisely which segment of your audience is affected.
In the Corriere della Sera data, both iPhone and Android appeared in the platform split, with Safari and Chrome as the corresponding browsers. A destination page that was not mobile-responsive or that loaded slowly on cellular would have been failing for every single scanner in that campaign. Platform data makes that failure visible before the campaign ends.
Before any QR code goes to print, test the destination on both an iPhone using the native camera app (opens in Safari) and a mid-range Android phone using Chrome. If either one shows a slow load, broken layout, or requires zooming to read, fix the destination before printing. Your platform data will tell you what percentage of your audience was on each device. That percentage is the size of the problem your pre-launch test either caught or missed.
Languages: The Tab Most People Never Open
Language data shows the device language setting of every person who scanned your code. It is not the same as geographic location, though the two often align. A scanner in Milan with an Italian device language setting is almost certainly a native Italian speaker. A scanner in Milan with an English device language setting might be an international visitor, an expat, or a business traveller.
For most domestic campaigns, the language tab will confirm what you already expect. For campaigns at airports, international retail locations, tourist attractions, or events with international audiences, language data can reveal a mismatch between your destination page's language and the language your scanners actually prefer.
IMQRScan's platform documentation specifically highlights that auto-language detection, which adapts a landing page based on the visitor's browser language setting, has become a meaningful engagement driver in non-English markets. If your language tab consistently shows a meaningful percentage of scanners in a language other than your destination page's language, that is a localisation opportunity with a measurable audience size attached to it.
Referrers: The Proof of Channel Attribution
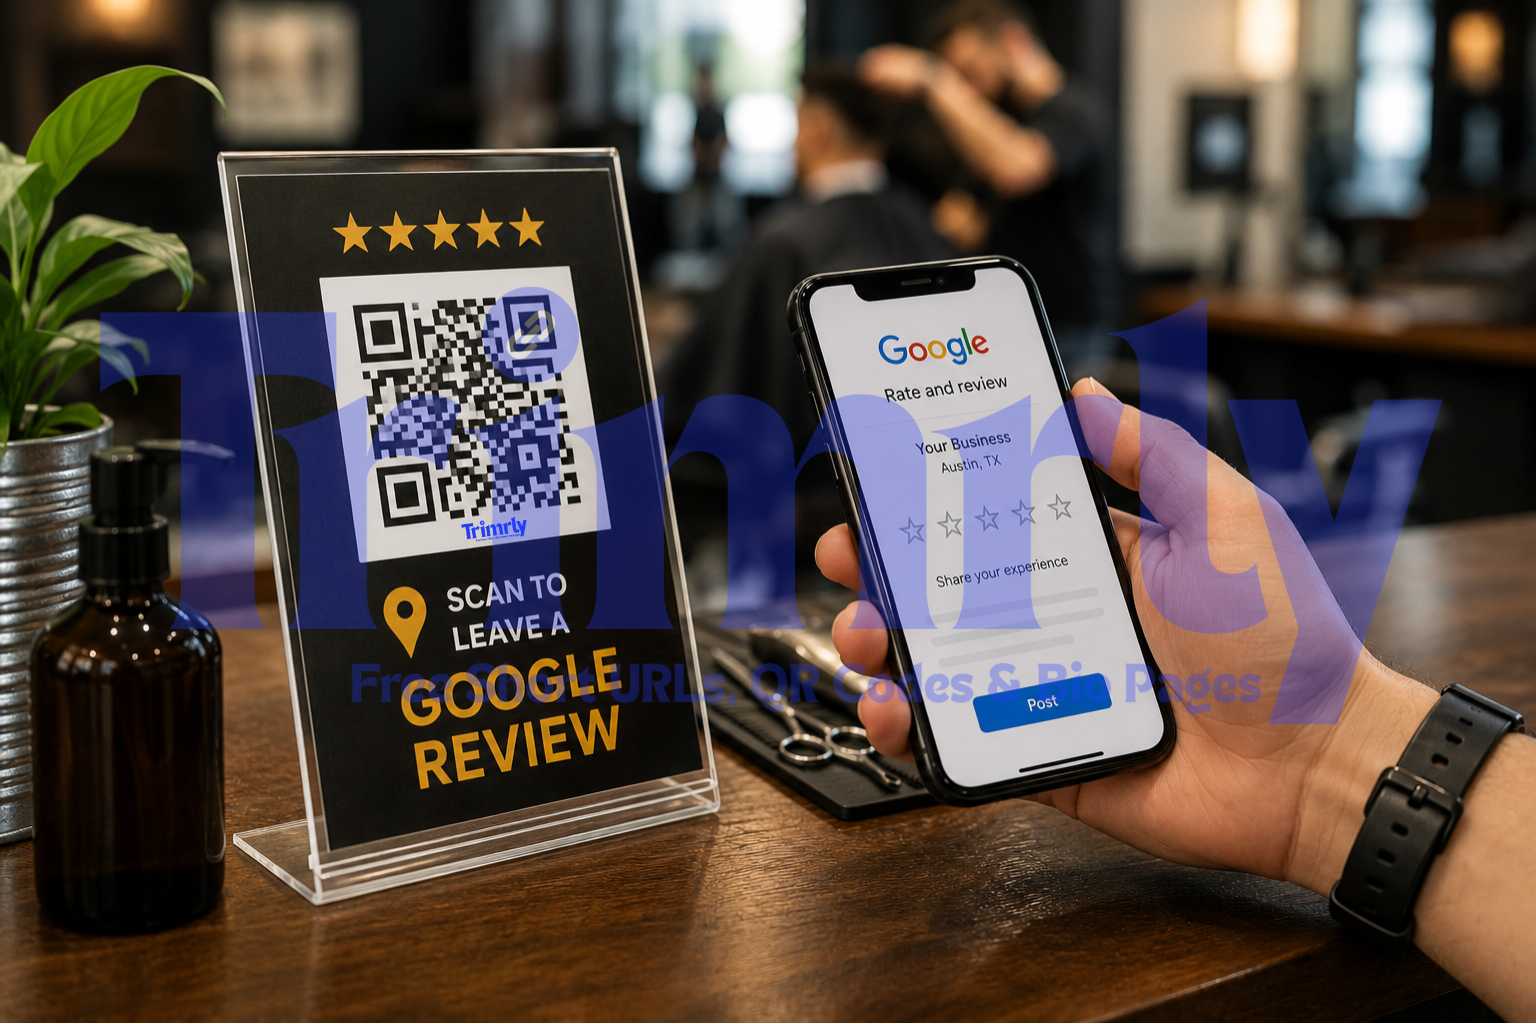
The Referrers tab is where print and physical marketing finally gets the attribution it has always deserved but historically could not prove.
Traditional print advertising has no reliable attribution mechanism. A newspaper ad runs, and if sales increase that week, the connection is assumed but not proven. With a QR code and a Referrers tab, the attribution is direct and timestamped. "Direct" as a referrer means someone physically scanned a printed code. That entry in your Referrers tab is evidence of a real person reading a real physical material and taking a digital action from it.
| Referrer Shown | What It Means | Typical Source |
|---|---|---|
| Direct | Camera app or QR scanner app used on physical code | Print ads, packaging, signage, business cards, menus |
| WhatsApp / Telegram | Someone shared the QR image digitally in a message | Photograph of the code forwarded via messaging app |
| Instagram / TikTok | Code image was reshared on a social post or story | User photographed and shared the printed material online |
| google.com | Scanned a digital image found via web search | Code appeared in a digitised version of the publication |
| t.co (Twitter/X) | Digital reshare via Twitter link | Code image tweeted and scanned from a screen |
The referrer breakdown also catches unexpected virality. A QR code placed in a print brochure that suddenly starts showing WhatsApp as a significant referrer tells you that someone photographed the brochure and forwarded the image to multiple contacts. That is a distribution event you would never have known about from a total scan count alone. The QR code has now effectively entered a new channel you did not plan for, and the Referrers tab is the only way to see it.
The Activity Feed: Reading Individual Scan Events
Below the summary cards, Trimrly's Recent Activity section shows each scan as a timestamped individual entry. The Corriere example shows three visible entries:
Three things stand out from these entries. First, the Brescia scan at 14:29 and the Milan scan at 14:37 on the same day are separated by eight minutes. Two different people, two different cities, scanning within minutes of each other. That pattern suggests the newspaper was read simultaneously across its distribution area, which is a geographic validation of the print run.
Second, the iPhone user in Brescia is using Chrome, not Safari. Most iPhone users who scan QR codes land in Safari automatically via the native camera app. A Chrome result on iPhone suggests this person had Chrome set as their default browser, which is less common but fully valid. It is a minor technical detail that produces no action, but it confirms the activity log is capturing genuine user behaviour rather than bot traffic.
Third, the timestamps cluster in the afternoon of 30 May and the morning of 31 May, the day of publication and the day after. That timing pattern is consistent with newspaper readership behaviour: people read the print edition on the day of publication and occasionally the following morning. The scan timing data is independently validating what media buying research says about print newspaper readership windows.
"A scan timestamp is not just a time. It is proof that a physical piece of printed material was in someone's hands at that exact moment. Print finally has its attribution layer."
How to Set Up Multiple QR Codes for the Same Campaign
One of the most powerful uses of QR analytics is deploying separate codes for separate placements within the same campaign and comparing their performance independently.
A business running a campaign across a print ad, a window sticker, and packaging inserts simultaneously can create three separate Trimrly QR codes, one for each surface, each with a clearly named alias that identifies the placement. All three codes point to the same destination URL. The analytics for each code are tracked separately in the dashboard.
Create a named short link for the destination
Go to Trimrly and create a short link to your destination URL with a readable alias. This is the URL all your QR codes will point to. Having it as a short link means you can update the destination later without regenerating any QR codes.
Create a separate QR code for each placement
Go to trimrly.com/free-qr-codes-generator and generate one code per physical surface. Give each a clear name that identifies the placement: "Print Ad — Corriere Milano — June", "Window Sticker — Milan Store", "Packaging Insert — Q2 Run". All three point to the same destination URL.
Compare scan data across codes after 30 days
After one month, open each code's analytics separately in your Trimrly dashboard. Compare total scans, unique scans, peak scan times, and city distribution across placements. The code with the highest unique scan rate is your best-performing surface. The one with the lowest is either poorly placed or reaching an audience that does not scan.
Update future budget allocation based on scan data
If the print ad code consistently outperforms packaging inserts by 3x on unique scans, your next campaign budget allocation should reflect that ratio. QR analytics turn what was an intuition-based spending decision into a data-backed one. Each placement now has a measurable cost per unique scan you can compare directly against other acquisition channels.
Every Scan Tracked. Every Placement Measured. Free.
Dynamic QR codes with the full analytics dashboard shown in this post. Countries, cities, devices, browsers, languages, referrers. 20 free codes per month, permanent data, no credit card.
The One Number That Determines Whether Your QR Code Strategy Is Working
Everything in this post leads to one calculation. Divide your unique scans by the estimated number of people who encountered your QR code in the physical world. Call the result your scan conversion rate.
For a newspaper half-page ad with a circulation of 100,000, 18 unique scans is a 0.018% scan conversion rate. That sounds low until you compare it to the cost per unique scan against other digital channels. A display ad typically achieves a 2 to 5% click-through rate on a much smaller served audience, and those clicks carry no channel attribution proof. The 18 unique scans from a newspaper ad are each confirmed, timestamped, city-attributed, device-identified actions taken by real people with a physical newspaper in their hands.
Dynamic QR codes show 60% higher engagement rates than static ones and are 3.5 times more likely to drive campaign optimisation, per Supercode's 2026 tracking research. The engagement difference comes from the ability to update the destination, not from the code itself. But the optimisation difference comes directly from analytics. You cannot optimise what you cannot measure, and static codes measure nothing.
Frequently Asked Questions
Total scans count every scan event including multiple scans from the same device. Unique scans count only the first scan from each device. QRLynx's 2026 benchmark data across 5 million scan events shows that 63.5% of all scans are repeats, meaning total scans overstate unique reach by approximately 2.7 times. Always use unique scans as your reach metric when reporting campaign performance to stakeholders.
A "Direct" referrer means the scanner used their camera app or a dedicated QR scanner app to scan a physical code. There was no web link, social share, or email click involved. For print ads, packaging, signage, and business cards, Direct is the expected and correct referrer. It is confirmation of the physical channel, not a gap in tracking. If a non-direct referrer like WhatsApp or Instagram appears, it means someone photographed and digitally reshared the physical material.
Trimrly's free plan tracks total scans, unique scans, top country, top referrer, and provides six detailed breakdown tabs: Summary, Countries and Cities, Platforms (device type and operating system), Browsers, Languages, and Referrers. Each tab shows a per-scan breakdown with timestamps. All data is stored permanently with no expiry. The free plan includes 20 dynamic QR codes per month, each with the full analytics dashboard, and no credit card is required.
Create a separate Trimrly QR code for each physical placement, with each code given a descriptive name that identifies its surface. All codes can point to the same destination URL. Each code tracks its own scan data independently in the Trimrly dashboard. After 30 days, compare unique scan counts across codes to identify which placement drives the most real reach. That comparison directly informs future budget allocation across placements.
QRLynx's 2026 data shows the median dynamic QR code receives very few scans relative to its potential distribution, with a 34% zero-scan rate across all codes created. Benchmarks vary significantly by placement context. Restaurant menus achieve the highest scan rates because the QR code directly solves an immediate need. Print ads and packaging inserts typically achieve lower raw rates but carry stronger attribution value per scan. Businesses that actively measure and optimise QR code performance report 37% average click-through rates on QR-initiated customer journeys compared to 2 to 5% for display advertising, per QR Insights 2026.