
Five years ago, a QR code on a product was a novelty. In 2019, fewer than one in five Americans had scanned one in the past month. Then, in a matter of weeks in early 2020, restaurant menus became QR codes, event check-ins became QR codes, and payment terminals in two billion emerging-market transactions became QR codes. The behaviour formed under necessity and it stayed.
By 2026, the adoption question is resolved. The technology is mainstream, the consumer behaviour is habitual, and 72% of consumers scan a QR code in any given month — up from below 20% in the pre-pandemic baseline. Over 2 billion QR code scans occur globally every day in 2026. The market has moved past whether QR codes work and into a more interesting and commercially relevant question: whether the businesses using them are measuring, optimising, and capturing the value the scans represent.
This article pulls together the most complete and thoroughly sourced collection of QR code statistics available for 2026 — covering market size, scan volumes, regional adoption, industry verticals, consumer behaviour, marketer trends, and the performance benchmarks that separate campaigns that drive revenue from campaigns that just generate scans. Every figure is attributed. Where numbers conflict across sources, we explain why.
QR Code Market Size and Growth Statistics
The global QR code market was valued at $13.04 billion in 2025 and is projected to reach $33.14 billion by 2030, at a compound annual growth rate of 20.5%. The payment side of the market is tracked separately. QR-based payments are expected to hit $3 trillion in annual spending globally, while the QR payment market infrastructure itself is a parallel billion-dollar category.
It is worth understanding why multiple market size figures circulate simultaneously. Research firms define the "QR code market" differently: some count only QR generation software and SaaS platforms; others include QR payment infrastructure; others include the supply chain, authentication, and healthcare QR markets. The global QR code payment market was valued at $10.28 billion in 2022 and is projected to reach $35.07 billion by 2030, growing at 17.03% annually. When you see figures ranging from $1.5 billion to $13 billion in the same year from different sources, the variation is definitional, not a measurement error.
The biggest single catalyst for QR code adoption in the next two years is not consumer behaviour — it is a regulatory deadline. By the end of 2027, GS1 QR Codes are targeted to replace traditional UPC barcodes across global retail — a regulatory shift that will create more QR codes in 2027–2028 than the entire pandemic adoption wave of 2020–2021. Every product on a retail shelf currently uses a UPC barcode. GS1's Sunrise 2027 programme requires retailers to accept 2D codes (including QR) at point-of-sale by the end of 2027. When the product packaging on 92% of CPG products carries a QR code rather than a UPC, the daily exposure to QR codes for the average consumer will increase dramatically — driving both scan behaviour and consumer expectation.
Global Scan Volume and Consumer Adoption Statistics
In 2025, global QR code scans surpassed 1 trillion for the first time — a milestone that reflects mainstream adoption across retail, hospitality, healthcare, and marketing. For context, 1 trillion scans at 365 days equals approximately 2.74 billion scans per day globally. Over 2 billion QR code scans occur globally every day in 2026.
As of 2026, 72% of consumers report having scanned a QR code in the past month — a dramatic shift from pre-pandemic levels when monthly scan adoption was below 20%. In the United States, over 102 million Americans will scan QR codes in 2026, roughly one in three Americans. 84% of mobile users worldwide have scanned a QR code at least once.
The regional picture reveals an interesting split. Asia-Pacific remains the undisputed leader in QR code adoption for payments — China processes over $5.5 trillion in transactions via QR. Chinese users interact with QR codes 10 to 15 times daily, making it the most QR-integrated society globally. But for marketing use cases, North America and Europe are where QR code sophistication — dynamic codes, tracked links, analytics-driven campaigns — is most developed.
Marketer Adoption and Campaign Performance Statistics
The marketer data paints an overwhelmingly positive picture on adoption but reveals a significant gap in measurement. 98% of marketers report a positive impact with QR codes, and 93% say they have increased their QR code usage in the past year. 86% plan further increases in usage in the next 12 months.
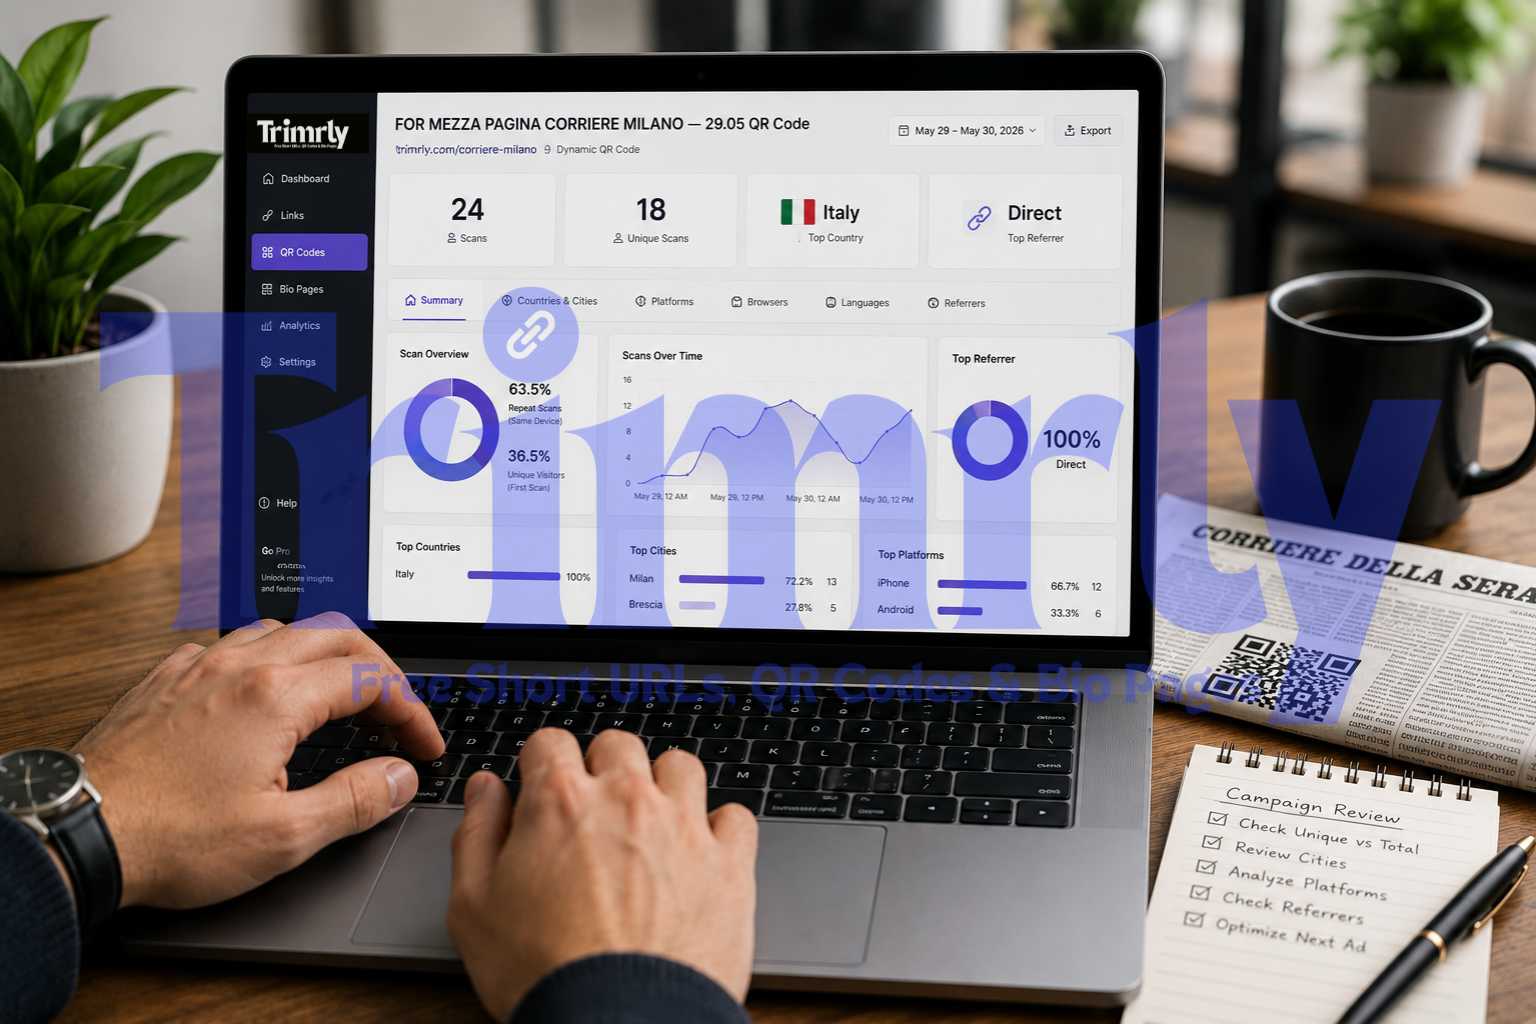
The measurement gap is the defining story of 2026. Only 1 in 8 marketers connects QR code scans to revenue impact. Analytics was the top improvement marketers wished for in QR code technology (49%), followed by faster loading (45%), dynamic QR codes (41%), and greater compatibility (38%). When the most wanted feature is analytics, the takeaway is clear: most marketers are running QR code campaigns without knowing whether they work.
47% of U.S. brand and agency marketers named attribution and measurement their top investment priority for 2025. Yet only 1 in 8 connects QR scans to revenue. This gap between stated priority and actual practice is where the performance advantage lives in 2026. The businesses that build scan-to-revenue attribution — through dynamic short links, UTM parameters, and proper GA4 channel setup — are operating with a data advantage that the majority of their competitors are not.
Industry-by-Industry Adoption and Performance Statistics
QR code adoption is uneven across industries, and the performance benchmarks vary significantly by sector. Restaurant and hospitality leads in adoption volume; retail leads in conversion value; healthcare is the fastest-growing emerging use case. Here is the complete breakdown.
| Industry | Adoption Rate | Primary Use Case | Performance Benchmark |
|---|---|---|---|
| Restaurants & Hospitality | 75% — highest of any sector | Digital menus, ordering, contactless payment | 42% of all QR scans globally |
| Retail & e-commerce | 46% | Product info, loyalty programmes, in-store-to-online bridge | 15–25% scan rates on product packaging; 20–40% conversion lift |
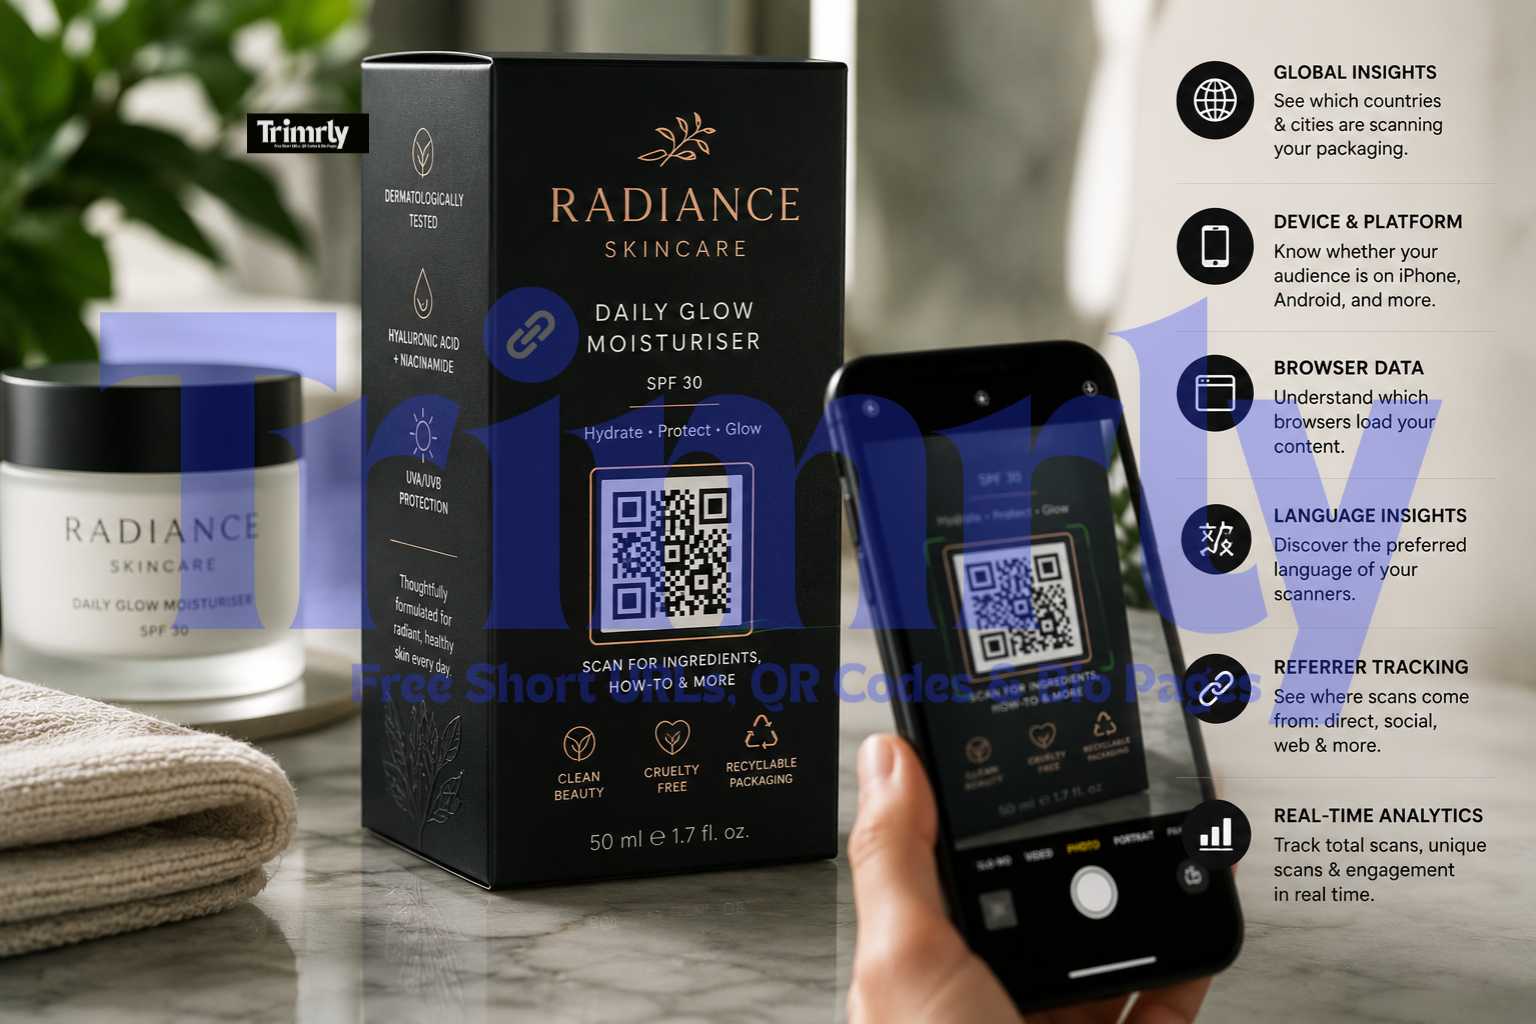
| Consumer Packaged Goods | 92% of CPG products carry a QR code | Ingredient transparency, recycling info, brand experience | 57% of shoppers scan food packaging QR codes |
| Events & Live Entertainment | Growing — 43% of marketers use QR specifically at events | Check-in, merch, feedback, sponsor engagement | Open houses with QR collect 50% more attendee data |
| Healthcare | 22% YoY growth in QR integrations | Patient check-in, lab tracking, prescription management, telemedicine | Fastest-growing adoption segment 2025–2026 |
| Real Estate | Rapidly increasing since 2023 | Yard sign listings, open house check-in, virtual tour access | 13.6% scan-to-lead conversion on Home Value Estimate codes |
| Automotive | Expanding across OEMs | Vehicle details, service history, digital owner manuals | Major OEM deployment across service and showroom infrastructure |
Consumer Behaviour Statistics: Why People Scan and What They Do Next
Understanding what motivates a scan is the most operationally useful insight in all of QR code research. The data from multiple 2025–2026 surveys converges on a clear answer: consumers scan for value, not novelty.
Consumers most often scan QR codes to access restaurant menus (48%) or product information (43%) — reflecting the dominance of informational use cases in everyday scanning behaviour. 75% of consumers scan for information. The implication for marketers: QR codes that offer clear informational value — "scan for the full ingredient list," "scan for the product tutorial," "scan to check availability" — consistently outperform QR codes that offer only brand promotion or novelty.
QR Code Demographic Statistics: Who Scans and How Often
QR code adoption is no longer a youth-only phenomenon. While 18–44 year olds remain the highest-frequency scanners, older demographics have rapidly closed the gap, driven particularly by necessity-based adoption in healthcare and service contexts.
Over 98% of QR code scans occur on smartphones. iOS accounts for approximately 54% of scans globally and Android 44%, with the remaining 2% from tablets and desktops. iOS leads in the US, UK, and Australia; Android dominates in India and Southeast Asia. This device split has direct implications for landing page design: both operating systems must scan cleanly and deliver a fast, mobile-optimised experience within three seconds of the scan.
The Six QR Code Trends That Define 2026
The statistics above are a snapshot. These six trends are the directional signals — the patterns that explain where those numbers are heading and what they mean for businesses building QR code strategies in 2026 and beyond.
Measurement Becomes the Competitive Moat
With 98% of marketers reporting positive QR impact but only 12% measuring to revenue, the businesses that build proper attribution — UTM parameters, dynamic links, GA4 custom channel groups — will operate with data advantages their competitors cannot easily replicate.
Dynamic QR Codes Replace Static as the Default
Dynamic QR codes already hold 65% market share. The gap is widening as businesses realise static codes become liabilities the moment a URL changes. By 2027, static codes will be the exception, not the norm, in any professional marketing context.
GS1 Sunrise 2027 Transforms Retail QR
The mandated replacement of UPC barcodes with 2D QR codes at retail checkout by end of 2027 will place a scannable code on every product in every store globally — creating a consumer scanning habit at a scale no marketing campaign could achieve.
QR Payments Hit $3 Trillion Annually
QR-based payment transactions reached $3 trillion globally — a 25% increase from 2022. With over 2.2 billion people using QR for payments, the association between scanning and transacting is embedding QR codes more deeply into daily financial behaviour than any marketing campaign could.
Healthcare Is the Fastest-Growing Vertical
A 22% year-over-year increase in healthcare QR integrations — patient check-in, lab sample tracking, telemedicine portals, prescription management — is creating a new wave of QR adoption among demographics that previously had low scan rates, particularly 55+ age groups.
Quishing — QR Phishing — Emerges as a Real Threat
Quishing — the use of fraudulent QR codes in phishing attacks — became a documented mainstream scam trend in 2025. Cybercriminals use QR codes in emails and physical signage to bypass URL filtering. The response: branded short links that establish visual trust before the scan, and consumer education about scanning only codes from known sources.
What These Statistics Mean in Practice: A Data-Driven Campaign
How Using the Statistics to Set Benchmarks Added 28% Revenue Attribution in One Quarter
A mid-size UK fashion retailer had been using static QR codes on in-store displays and packaging inserts for two years. They assumed the codes worked because they saw some direct traffic increases in GA4 — but they could not isolate QR-driven sessions from genuine direct traffic. They knew the adoption rate was probably fine — the statistics suggested it should be — but they had no data to prove it for their specific audience.
In Q2 2025, the retailer implemented the full three-layer stack across every physical material: UTM-tagged destination URLs, dynamic Trimrly short links as intermediaries, and QR codes generated from those short links. They created unique aliases per store location, per placement type (fitting room vs packaging vs window display), and per campaign. A custom QR channel group in GA4 separated QR-driven sessions from all other direct traffic.
Within eight weeks, the data revealed three findings that changed their marketing strategy. First, fitting room QR codes — where shoppers could scan to see available sizes and colours online — had a 31% scan rate and a 22% add-to-cart rate. This was the highest conversion rate in the entire retail marketing stack. Second, packaging insert QR codes were generating repeat purchase visits at 18% above the site average — but 94% of these visits had previously been attributed to direct traffic. Third, the window display QR codes — their most expensive printed material — had a scan rate of 2%, well below the 15–25% benchmark for retail product packaging.
The retailer tripled investment in fitting room QR display, maintained packaging inserts, and reduced window display QR budgets in favour of counter signs. Revenue attributed to QR-sourced sessions increased 28% in Q3 2025 from the same period the prior year, with no change in total print spend.
Join the 12% Who Actually Measure QR to Revenue
Dynamic QR codes, tracked short links, and permanent analytics — in one free Trimrly account. 20 QR codes per month, unlimited clicks, SVG download for print, and scan data that actually tells you what is working.
"QR codes are no longer a question of whether consumers use them. The question is whether the businesses deploying them are capturing what those scans are actually worth."
Frequently Asked Questions
102.6 million Americans are projected to scan QR codes in 2026, roughly one in three Americans. Globally, over 2 billion QR code scans occur every day. 72% of consumers report having scanned a QR code in the past month, up from below 20% pre-pandemic. 84% of mobile users worldwide have scanned a QR code at least once. Global scans surpassed 1 trillion for the first time in 2025.
The global QR code market was valued at $13.04 billion in 2025 and is projected to reach $33.14 billion by 2030 at a 20.5% CAGR. The QR payment market is tracked separately — valued at approximately $15.95 billion in 2025 with QR-based payment transactions reaching $3 trillion annually. In the US specifically, the QR code market is forecast to reach $389 million in 2026, up 67% from its 2023 value of $233 million.
Restaurants and hospitality lead QR adoption at 75% industry adoption — the highest of any sector — and account for 42% of all global QR code scans through digital menus, ordering, and contactless payment. Retail and e-commerce follows at 46% adoption. CPG product packaging is notable with 92% of consumer packaged goods carrying a QR code. Healthcare is the fastest-growing adoption segment with 22% year-over-year growth in QR integrations.
Exclusive content or information is the #1 driver at 39%, followed by discounts or promotional offers (33%), contest entries (14%), and loyalty points (12%). 75% of consumers scan QR codes for information — menus (48%) and product information (43%) are the most common use cases. QR codes that offer clear, specific value before the scan consistently outperform those that rely on curiosity or brand promotion alone.
A static QR code permanently encodes its destination URL. If the destination changes, the code is broken and must be reprinted. A dynamic QR code stores a short redirect link — the destination can be updated anytime without changing the printed code. Dynamic codes also provide scan analytics (volume, device, geography, timestamp). Dynamic QR codes now hold 65% market share and are the standard for any business using QR codes for marketing, events, packaging, or printed materials where the destination might need to change.